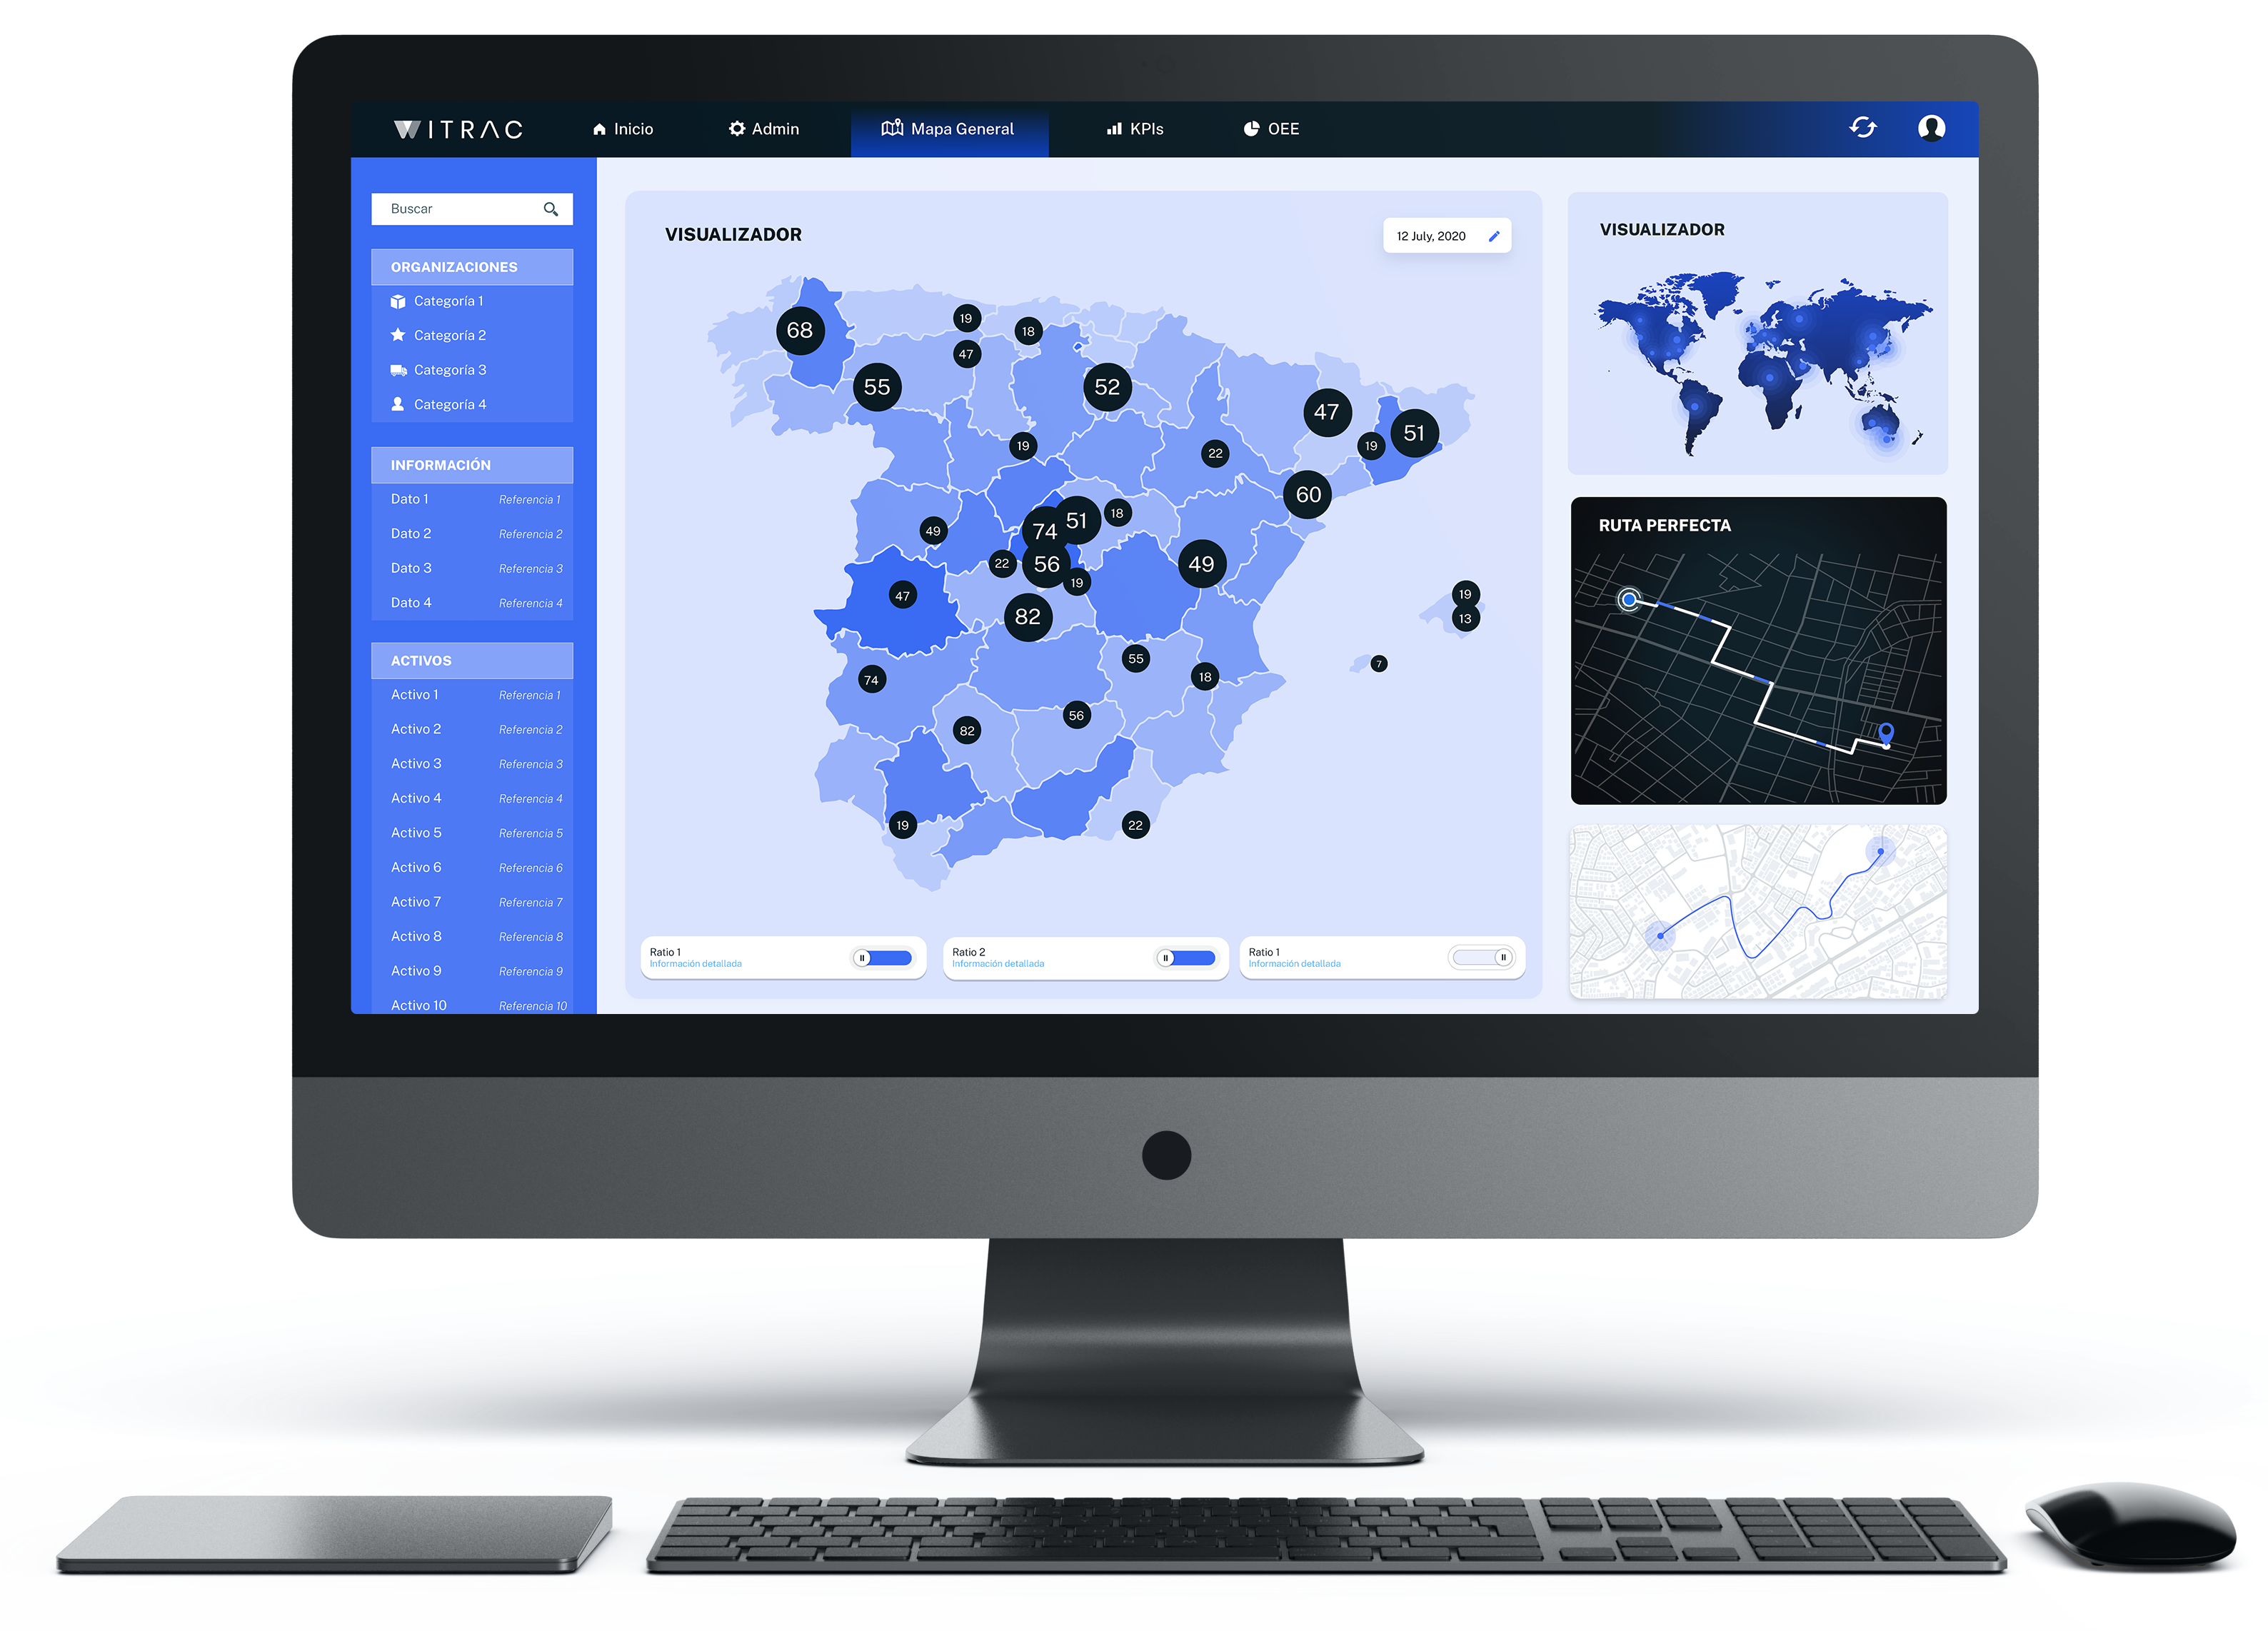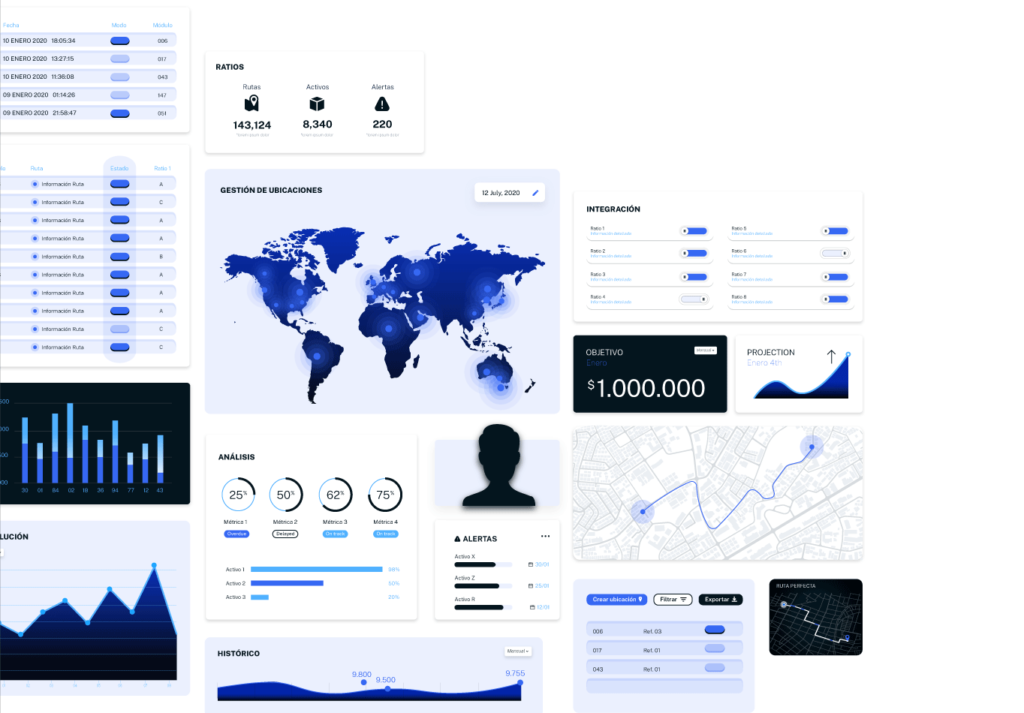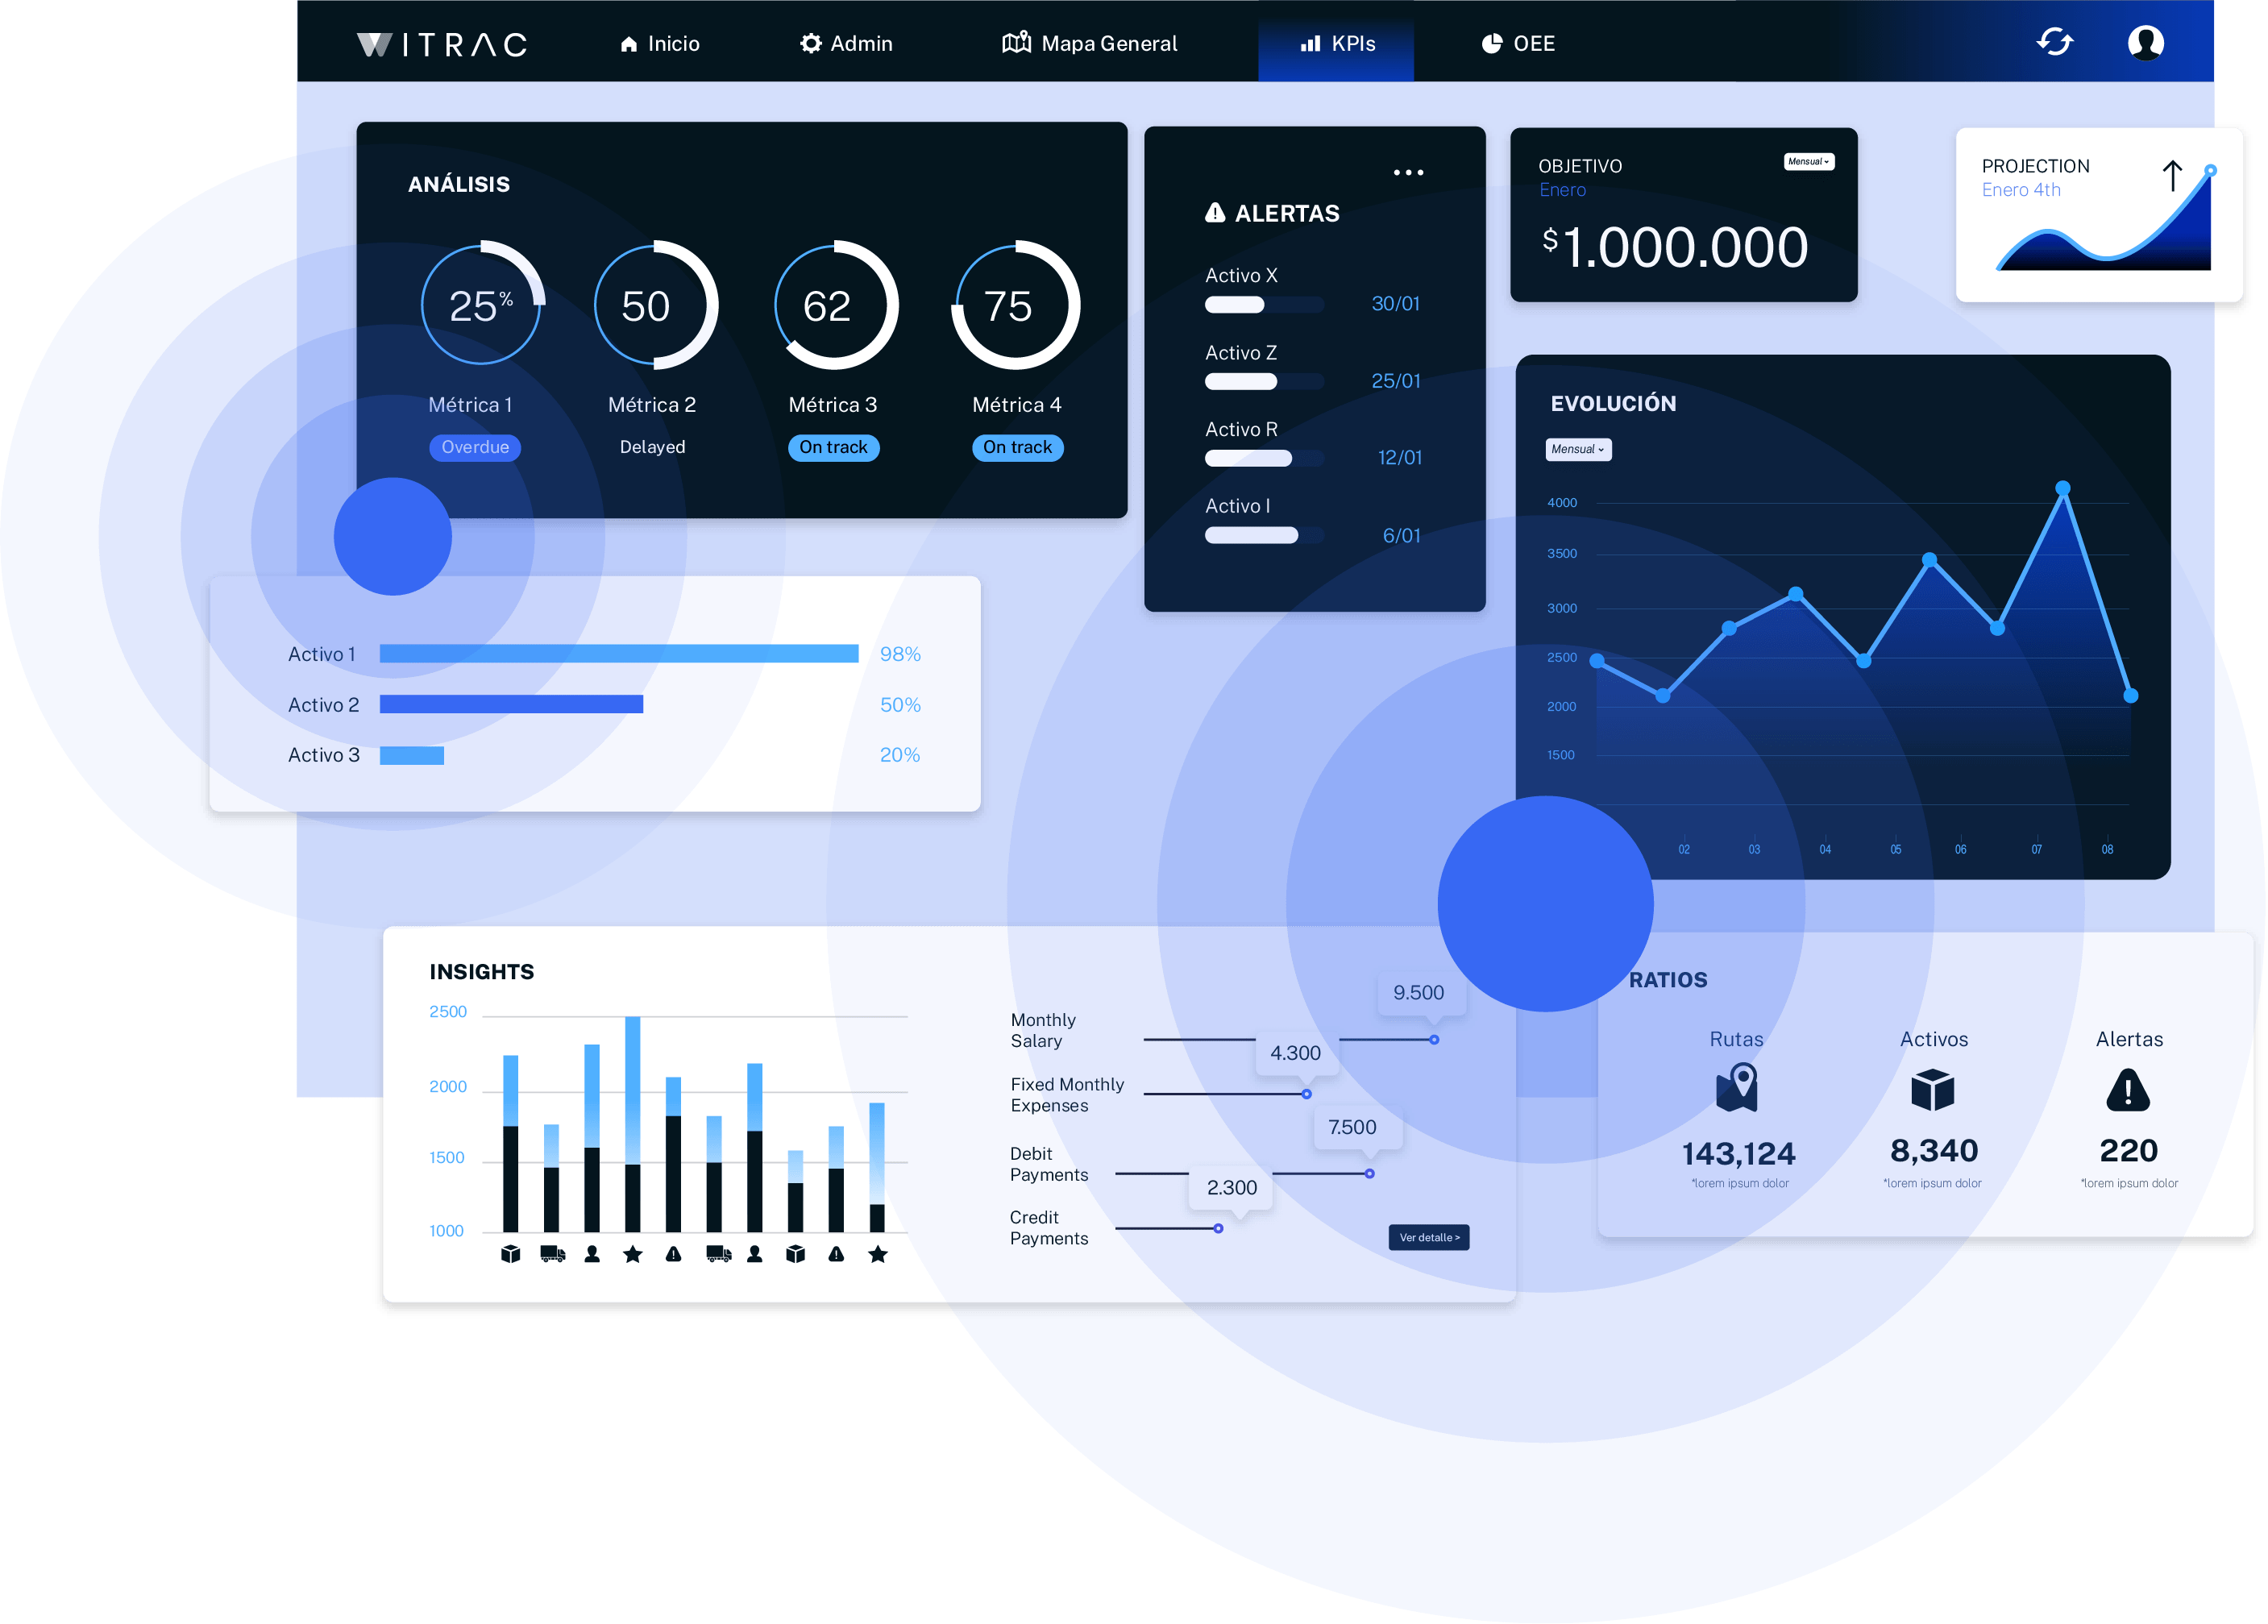


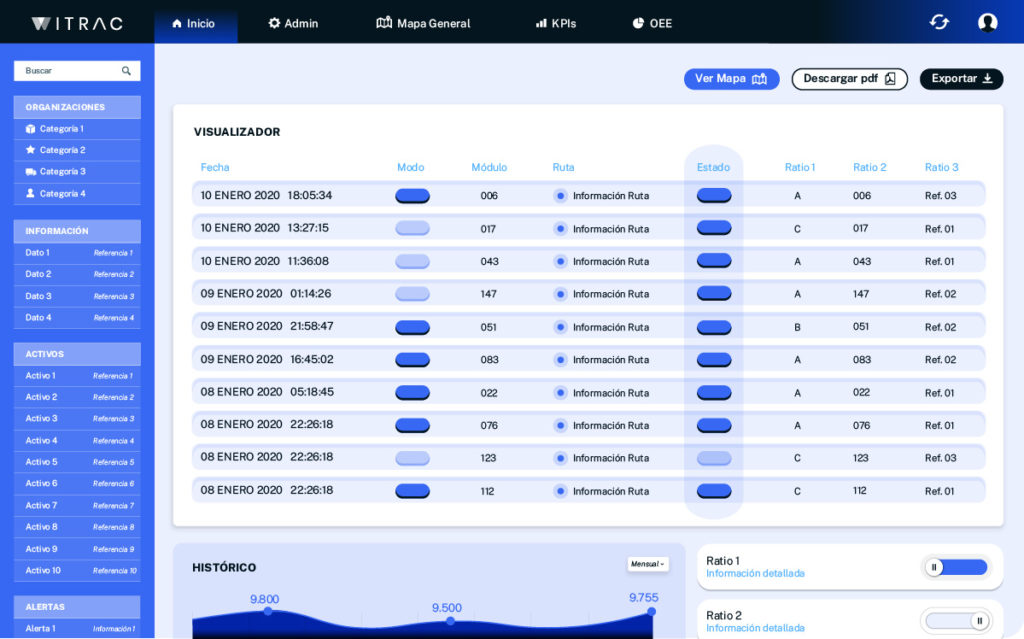

Graphical and visual access to data. Real-time, detailed and historical logs displayed in table format, charts showing evolution, as Excel data downloads and as pdf reports.
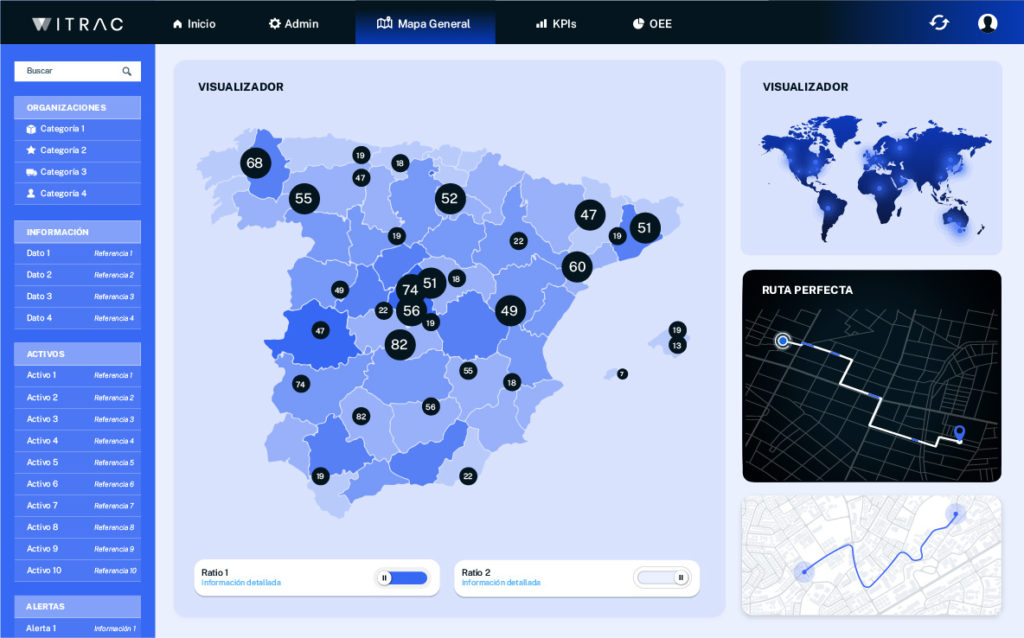
Visual representation of routes and monitoring/tracking of route compliance. Creation of the ideal theoretical route, assignment of point of origin and end, real route versus ideal route display, speed and position tracking, arrival time calculation and theoretical speed to improve asset efficiency.
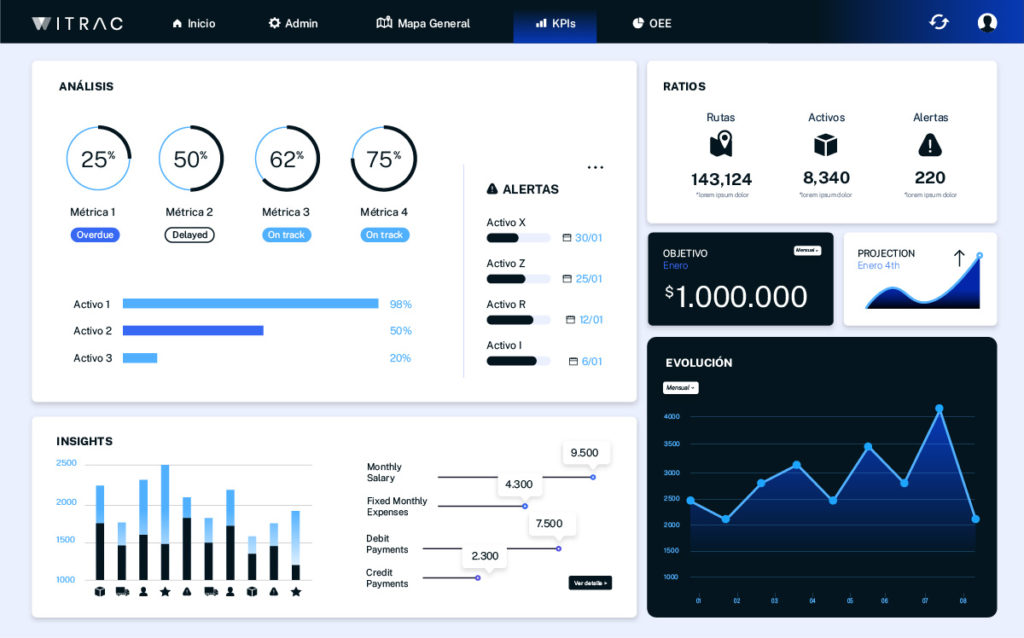
Display of indicators and insights calculated from the data. Distribution of devices by type of location or points of interest, residence times and classification by measured variables (temperature, movement, etc.).
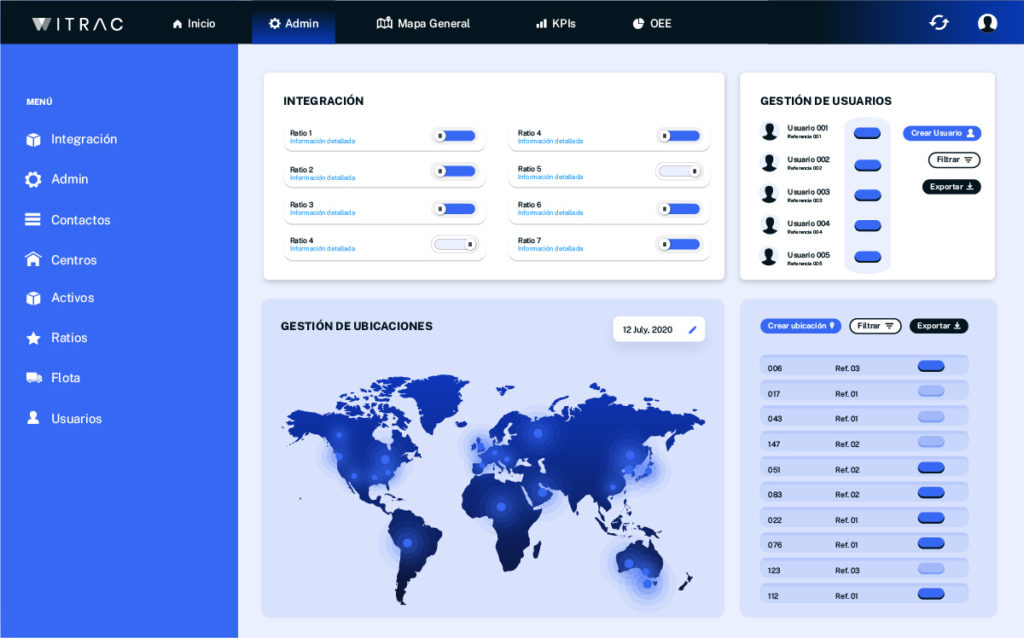
Device and platform configuration. Changing infrastructure configuration parameters (e.g. frequency at which devices emit), management of information masters (points of interest, centers, etc.) and device groups, creation of users, and assignment of permissions and roles.
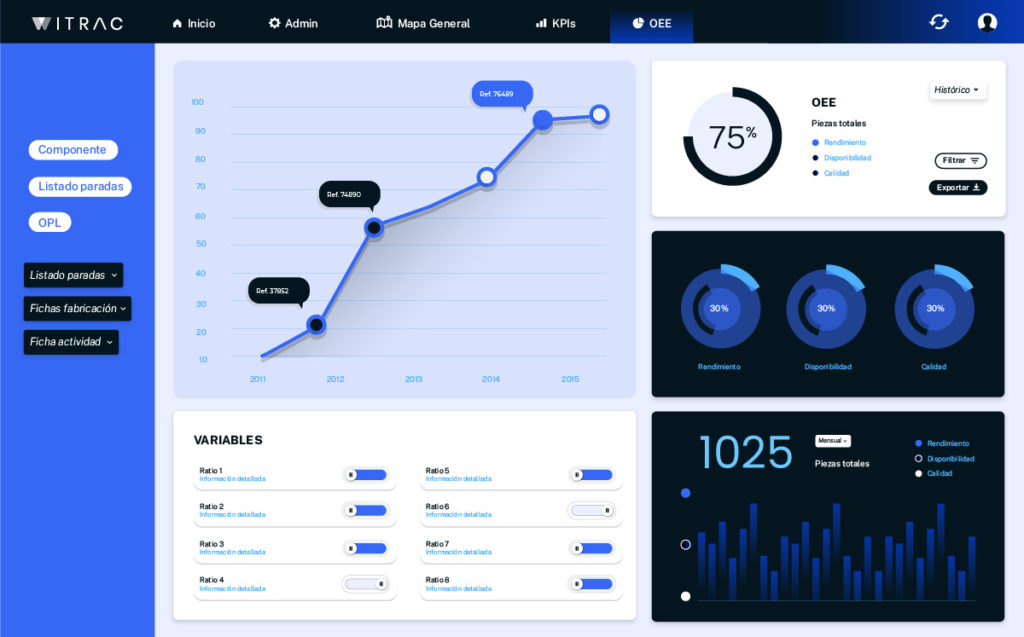
Industrial efficiency and logistics indicators. Calculation of energy consumption by machines or vehicles, measurement of actual versus theoretical production, calculation of cycle times and deviations, assignment of work orders to operators and tracking
Graphical and visual access to data. Real-time, detailed and historical logs displayed in table format, charts showing evolution, as Excel data downloads and as pdf reports.
Visual representation of routes and monitoring/tracking of route compliance. Creation of the ideal theoretical route, assignment of point of origin and end, real route versus ideal route display, speed and position tracking, arrival time calculation and theoretical speed to improve asset efficiency.
Display of indicators and insights calculated from the data. Distribution of devices by type of location or points of interest, residence times and classification by measured variables (temperature, movement, etc.).
Device and platform configuration. Changing infrastructure configuration parameters (e.g. frequency at which devices emit), management of information masters (points of interest, centers, etc.) and device groups, creation of users, and assignment of permissions and roles.
Industrial efficiency and logistics indicators. Calculation of energy consumption by machines or vehicles, measurement of actual versus theoretical production, calculation of cycle times and deviations, assignment of work orders to operators and tracking